
Building a SOC with Azure Sentinel: Detection Engineering & SOAR Automation
Table of Contents
Introduction
The main goal of this project is to gain a deeper understanding of the Tactics, Techniques, and Procedures (TTPs) that threat actors use to exploit their targets. Additionally, this project aims to develop and leverage detection rules to alert our Security Information and Event Management (SIEM) system, increasing visibility across our network and reducing response time to potential security incidents.

-
What is a SIEM?
A SIEM is a centralized system that ingests logs from any source where an agent is installed. These agents can run on devices such as servers, endpoints, or applications and forward specified logs to the SIEM. There, we can ruery and correlate the data to gain valuable insights.A SIEM consists of:
- Data collectors/agents
- Collection and normalization
- Parsing and enrichment
- Correlation engine
- Detection rules
- Threat intelligence
- SOAR (Security Orchestration, Automation, and Response)
- Dashboards
- Reports
Most of the resources I used were hosted on Azure. I chose Azure for a few reasons: first, they offer a $100 credit for students; second, I prefer their user interface. One thing to note, the SOAR section requires your own tenant.
That said, the only resource hosted outside of Azure is a Kali Linux virtual machine running on my PC, which I used to generate logs for the VMs.
For brevity, I will skip the initial setup and configuration of the infrastructure. All resources can be deployed automatically using my Terraform script.
I focused on: data collection rules, Sentinel, detection rules, and SOAR. The most crucial components of this project are the data collection rules. These rules serve as our eyes and ears within the network; without them, we would be blind.
Setup
Requiremets:
| Type | Count |
|---|---|
| Data collection rule | 4 |
| Public IP address | 2 |
| Disk | 2 |
| Flow log | 3 |
| Network security group | 2 |
| Network Interface | 2 |
| Virtual machine | 2 |
| Virtual network | 1 |
| Log Analytics workspace | 1 |
| Data collection endpoint | 1 |
| Network Watcher | 1 |
Terrafrom Script
The Terraform script deploys most of the infrastructure required to run the lab, with the exceptions being Sentinel related items, and the data collections rules; which would have to be manually created.
-
To deploy it you will need to install Terraform. Click here for install guide
-
You will also need azure-cli Click here for install guide
-
Once installed confirm installation by running
terraform -version ; az version -
run
az loginwhich will bring up a login prompt on your default browser, login and then close the browser and return to the cli. -
run
az account list --output tableto see available subscriptions and note the subscription ID of the subscription you want to build the infrastructure under. -
run `az account set –subscription “
” -
verify change by running
az account show -
Clone repo with
git clone https://github.com/c-d-a2/azure-soc-net.git -
Change directory to Terraform
-
run
terraform init && terraform plan && terraform apply -
Confirm build on azure platform
Data collection
Once the resources have been deployed to azure, we can proceed with creating Data Collection Rules for our endpoints. Data Collection Rules essentially define what will be forwarded to the Log-analytics workspace and Sentinel.
I’ve set up two rules for our Windows VM , one rule for our Linux VM.
- winsec-law:
- forwards windows security events
- winevents-law
- forwards windows system,application,sysmon,firewall,and powershell event logs
- linuxsyslog-law
- forwards syslogs
Creating a Data Collection Rule
- Search for Data Collection Rule on search bar and Select matching result.
- Select Create

- Give it a descriptive name , preferably something that mentions what is being forwarded and fill the required options.

- Select Scope or the resources that the Data Collection Rule will apply to.

- Select where the logs will be forwarded to; this should be the log analytic workspace.

- Create a tag if you’d like and Review and the Create
I did run into some difficulty enabling more verbose logging on the windows endpoint as the Data Collection Rule UI only has System, Application and Security Events to select from. To forward other logs like sysmon,firewall and powershell script block logs, some additional configuration is required on the windows endpoint. I made a script to enable this which can be found here .
Once logging is enabled on the endpoints and linked to your Log Analytic Workspace we are ready to start looking through logs in the Logs tab within the logs analytic workspace or on sentinel. Please note that the logs may take some time to start being ingested ; however, provided all configuration is correct you should start receiving logs in as little as 10 minutes.
Creating Detections
-
What is MITRE ATT&CK?
The MITRE ATT&CK framework is a knowledge base of the Tactics, Techniques, and Procedures (TTPs) that threat actors have used in real-world attacks. Organizations and individuals can leverage this framework to emulate these techniques on endpoints and test their detection capabilities.
I used the MITRE ATT&CK framework to study and emulate attacks observed in the wild. The goal was to engineer queries capable of detecting specific TTPs and Indicators of Compromise (IOCs) in our logs, triggering alerts when relevant activity occurs.
I began by researching common TTPs using the MITRE ATT&CK framework, focusing specifically on Defense Evasion and Persistence. Once I identified the sub-techniques I wanted to detect, I researched how these techniques were applied in real-world scenarios and began crafting queries to detect them.
This process proved more complex than I initially anticipated. I had to consider the many ways these attacks could be executed, legitimate uses of the tools involved, obfuscation techniques, and more. Consequently, I quickly found myself straying beyond the original scope of my queries.
I faced a crucial decision: how broad or narrow should my queries be? Too broad, and there’s a substantial risk of false positives; too narrow, and critical activity or attacks might be missed. The objective is to craft a Goldilocks query—just right.
Query T1562.004
For example take this query that maps to T1562.004 * Impair Defenses: Disable or Modify System Firewall*:
Event
| where EventLog == "Microsoft-Windows-Windows Firewall With Advanced Security/Firewall"
| where EventID in (2003, 2006, 2097)
| project TimeGenerated, EventID, Computer, RenderedDescription, SID = UserName
The amount of false positives that this query returned was not ideal. Useful query to see any modification of the firewall, sure. However, as an analytic it was too broad, too noisy. If you wanted an effective query to detect any malicious attempt at modifying the firewall you would have to base the query off requested query and research conducted.
For instance, Take the following articles and methods that can be used to modify the firewall:
Russian Government Cyber Activity Targeting Energy and Other Critical Infrastructure Sectors
netsh firewall set opmode disable

netsh advfirewall set allprofiles state off

reg add "HKLM\SYSTEM\CurrentControlSet\Services\SharedAccess\Parameters\FirewallPolicy\StandardProfile\GloballyOpenPorts\List" /v 3389:TCP /t REG_SZ /d "3389:TCP:*:Enabled:Remote Desktop" /f

reg add "HKLM\SYSTEM\CurrentControlSet\Services\SharedAccess\Parameters\FirewallPolicy\DomainProfile\GloballyOpenPorts\List" /v 3389:TCP /t REG_SZ /d "3389:TCP:*:Enabled:Remote Desktop" /f
The Nearest Neighbor Attack: How A Russian APT Weaponized Nearby Wi-Fi Networks for Covert Access
> `cmd.exe /C netsh advfirewall firewall add rule name="Remote Event Log Management SMB" dir=in action=allow protocol=tcp localport=12345 > C:WindowsTempMSI28122Ac.LOG 2>&1`
>
> `cmd.exe /C netsh interface portproxy add v4tov4 listenaddress=172.33.xx.xx listenport=12345 connectaddress=172.20.xx.xx connectport=445 > C:WindowsTempMSI2cBfA24.LOG 2>&1`
PHOSPHORUS Automates Initial Access Using ProxyShell
"netsh" advfirewall firewall add rule name="Terminal Server" dir=in action=allow protocol=TCP localport=3389
you would need to monitor the modifying user, modifying application, rule direction, etc.
Manage Windows Firewall with the command line
New-NetFirewallRule -DisplayName "Allow Inbound Telnet" -Direction Inbound -Program %SystemRoot%\System32\tlntsvr.exe -RemoteAddress LocalSubnet -Action Allow -Group "Telnet Management"

New-NetFirewallRule -DisplayName "Block Outbound Telnet" -Direction Outbound -Program %SystemRoot%\System32\tlntsvr.exe -RemoteAddress LocalSubnet -Action Allow -Group "Telnet Management"


Set-NetFirewallRule -DisplayName "Allow Web 80" -RemoteAddress 192.168.0.2
Using Windows Firewall with Advanced Security
/********************************************************************++
Copyright (C) Microsoft. All Rights Reserved.

Abstract:
    This C++ file includes sample code that adds a outbound rule for
    the currently active profiles to allow a TCP connection using
    the Microsoft Windows Firewall APIs.

--********************************************************************/

#include <windows.h>
#include <stdio.h>
#include <netfw.h>

#pragma comment( lib, "ole32.lib" )
#pragma comment( lib, "oleaut32.lib" )


// Forward declarations
HRESULT     WFCOMInitialize(INetFwPolicy2** ppNetFwPolicy2);


int __cdecl main()
{
    HRESULT hrComInit = S_OK;
    HRESULT hr = S_OK;

    INetFwPolicy2 *pNetFwPolicy2 = NULL;
    INetFwRules *pFwRules = NULL;
    INetFwRule *pFwRule = NULL;

    long CurrentProfilesBitMask = 0;

    BSTR bstrRuleName = SysAllocString(L"OUTBOUND_RULE");
    BSTR bstrRuleDescription = SysAllocString(L"Allow outbound network traffic from my Application over TCP port 4000");
    BSTR bstrRuleGroup = SysAllocString(L"Sample Rule Group");
    BSTR bstrRuleApplication = SysAllocString(L"%programfiles%\\MyApplication.exe");
    BSTR bstrRuleLPorts = SysAllocString(L"4000");

    // Initialize COM.
    hrComInit = CoInitializeEx(
                    0,
                    COINIT_APARTMENTTHREADED
                    );
Sysmon Event ID 1 gives us the ability to be a bit more granular in our queries.
The important logic follows the second extend definition, where we specify the conditions that must be satisfied in the results of our query, including the presence of powershell or cmd in the ParentCommandLine and the inclusion of advfirewall.
Event
| where EventID == 1
| extend ParsedXml = parse_xml(EventData)
| mv-apply DataField = ParsedXml.DataItem.EventData.Data on (
    extend Name = tostring(DataField["@Name"]),
           Value = tostring(DataField["#text"])
)
| summarize EventData = make_bag(pack(Name, Value)) by TimeGenerated, Computer, EventID
| extend
    PID = tostring(EventData["ProcessId"]),
    ModifyingUser = tostring(EventData["User"]),
    Process = tostring(EventData["Image"]),
    CommandLine = tostring(EventData["CommandLine"]),
    PPID = tostring(EventData["ParentProcessId"]),
    ParentCommandLine = tostring(EventData["ParentCommandLine"]),
    LogonId = tostring(EventData["LogonId"])
| where ParentCommandLine contains "powershell" or ParentCommandLine contains "cmd"
| where CommandLine contains "advfirewall"
| project TimeGenerated, Computer,Process,PID,CommandLine, PPID, ParentCommandLine, ModifyingUser, LogonId

Having a baseline is tremendously helpful, as it allows you to quickly identify abnormal activity that deviates from the norm. For example, if PowerShell is not typically used in your environment, we can flag it immediately. If your organization does use PowerShell extensively then you will have to be more specific to reduce any false positives.
It was at this point that I decided to learn more about the Detection Engineering process and came across several resources that helped refine my understanding. I then chose to follow a more methodical approach when creating the second query.
- Alerting and Detection Strategy
- What is Detection as Code? How to implement Detection-as-Code
- Automating Detection-as-Code
- The Always-On Purple Team: An Automated CI/CD for Detection Engineering
- The Detection Engineering Process w/ Hayden Covington #livestream
- A Blue Print for Detection Engineering
Query T1543.002
The next query is focused on the MITRE ATTACK ID ID: T1543.002 which maps to Create or Modify System Process: Systemd Service.
-
What were detecting and initial expectations | Persistence via service
- Expected Volume: The expected volume is relative to how large your environment is; however, we should consider the fact that modifying and enabling a service is not a common occurrence.
- Data Source: Linux Syslogd or Auditd
- Pseudo Query: if
/etc/systemd/systema unit file in the directory is modified or file is added. - Scope –> This query will only monitor files that have been created or modified in the
/etc/systemd/systemand/etc/init.ddirectory.
-
Research
- Legitimate Uses:
systemdis the initialization system that brings up user-space services, runs as PID 1 and is started by the kernel . Administrators will often leverage the capabilities ofsystemdto manage their systems. For example, starting and stopping daemons, creating unit files to automatically start services upon start-up, modifying the behavior of services and more. Services are defined in Unit FIles which is a structured way to specify a resource that is being managed by systemd. There are a number of different Unit types. The most commons ones are.socket,.target,.service - Different ways of creating a service
- The use of most binaries to create or modify files can be used to create a service.
- Editing Existing Unit Files / Overrides: Administrators or threat actors can leverage the
systemctlbinary to edit existing Unit Files to modify their behavior with thesystmectl edit <unitfile>command, Or they can also directly edit a unit file.
- Resources:
- Setting Up a
systemdService - Linux Persistence Techniques Detected by AhnLab EDR
- New TeleBots backdoor: First evidence linking Industroyer to NotPetya
- Springtail: New Linux Backdoor Added to Toolkit
- Hildegard: New TeamTNT Cryptojacking Malware Targeting Kubernetes
- ATT&CK T1501: Understanding systemd service persistence
- Setting Up a
- Legitimate Uses:
-
Query
The query monitors the specified directories above by using regex and looking for any binary i.e., vim,echo,nano,tee,touch,vi,cp,lnthat may be used to edit or create a unit files.
It subsequently looks for any Syslog events that indicate systemd was reloaded. Finally, the results are joined together and it displays all of SystemdCreationOrEdits events and the latest daemon-reload .
let SystemdCreationOrEdits = Syslog
| where SyslogMessage matches regex @"\b(|mv|tee|touch|echo|vim|vi|nano|cp|ln)\b\s+/etc/systemd/system/"
   or SyslogMessage contains "systemctl edit"
   or SyslogMessage matches regex @"\b(mv|tee|touch|echo|vim|vi|nano|cp|ln)\b\s+.*?/etc/init.d/"
| project CreationOrEditTime = TimeGenerated, CreationMessage = SyslogMessage, HostName, HostIP;

let LatestReload = Syslog
| where SyslogMessage == "Reloading."
| summarize LastReloadTime = max(TimeGenerated);

SystemdCreationOrEdits
| extend LastReloadTime = toscalar(LatestReload)Name, HostIP, CreationMessage, ReloadTime
- Backtest
Unfortunately, our SIEM has not been running long enough to conduct an adequate backtest. I settled by running the following commands:
#!/bin/bash/

sudo vim /etc/systemd/system/my.service
sudo touch /etc/systemd/system/my.service
sudo cp my.service /etc/systemd/system/my1.service
sudo mv my2.service /etc/systemd/system/
sudo ln -s ~/my.service /etc/systemd/system/my4.service
sudo systemctl edit --full my.service
sudo systemctl edit my.service
echo "[Unit]\nDescription=Example" | sudo tee /etc/systemd/system/my5.service
sudo systemctl daemon-reload
The query was able detect all of the commands.

In a real environment, you would want to test the query against historical data, minimum of 30 days, the more, the better. The goal is to analyze the results and tune the alert if needed, perhaps you decide the query is too noisy, you can then narrow it down to your liking.
- Canary –> I will be using Atomic Red Team’s T1543.002 to test by query.
echo "#!/bin/bash" > /etc/init.d/T1543.002
echo "### BEGIN INIT INFO" >> /etc/init.d/T1543.002
echo "# Provides : Atomic Test T1543.002" >> /etc/init.d/T1543.002
echo "# Required-Start: \$all" >> /etc/init.d/T1543.002
echo "# Required-Stop : " >> /etc/init.d/T1543.002
echo "# Default-Start: 2 3 4 5" >> /etc/init.d/T1543.002
echo "# Default-Stop: " >> /etc/init.d/T1543.002
echo "# Short Description: Atomic Test for Systemd Service Creation" >> /etc/init.d/T1543.002
echo "### END INIT INFO" >> /etc/init.d/T1543.002
echo "python3 -c \"import os, base64;exec(base64.b64decode('aW1wb3J0IG9zCm9zLnBvcGVuKCdlY2hvIGF0b21pYyB0ZXN0IGZvciBDcmVhdGluZyBTeXN0ZW1kIFNlcnZpY2UgVDE1NDMuMDAyID4gL3RtcC9UMTU0My4wMDIuc3lzdGVtZC5zZXJ2aWNlLmNyZWF0aW9uJykK')) \" " >> /etc/init.d/T1543.002
chmod +x /etc/init.d/T1543.002
if [ $(cat /etc/os-release | grep -i ID=ubuntu) ] || [ $(cat /etc/os-release | grep -i ID=kali) ]; then update-rc.d T1543.002 defaults; elif [ $(cat /etc/os-release | grep -i 'ID="centos"') ]; then chkconfig T1543.002 on ; else echo "Please run this test on Ubnutu , kali OR centos" ; fi
systemctl enable T1543.002
systemctl start T1543.002
echo "python3 -c \"import os, base64;exec(base64.buf64decode('aW1wb3J0IG9zCm9zLnBvcGVuKCdlY2hvIGF0b21pYyB0ZXN0IGZvciBtb2RpZnlpbmcgYSBTeXN0ZW1kIFNlcnZpY2UgVDE1NDMuMDAyID4gL3RtcC9UMTU0My4wMDIuc3lzdGVtZC5zZXJ2aWNlLm1vZGlmaWNhdGlvbicpCg=='))\"" | sudo tee -a /etc/init.d/T1543.002
systemctl daemon-reload
systemctl restart T1543.002
Dashboards
Creating a workbook/dashboard is incredibly useful because it allows you to draw valuable insights from your queries. We can visualize the data to quickly identify trends and spot anomalies.
Given I had two VMS exposed to the internet, I created a heat map and two pie charts to visualize where the attacks were coming from , most attempts by IP and usernames attempted.
- You can create a workbook by navigating to the Defender portal > Microsoft Sentinel > Threat Management > Workbooks
- Clicking Add Workbook
- Edit on the Upper right-hand corner
- Clicking Add: this will open a dropdown menu. Here you can select what type of data you will be adding. The data i will be using is data source + visualization.
- Click Done Editing and save.
let winThreshold = 10;
let sshThreshold = 10;
let lookback = 24h;

let WindowsFailures =
    SecurityEvent
    | where EventID == 4625
    | where TimeGenerated > ago(lookback)
    | summarize Attempts = count()
        by SrcIP = tostring(IpAddress), TimeBucket = bin(TimeGenerated, 1h),HostName = Computer
    | where Attempts >= winThreshold
    ;


let IpRegex = @"\b\d{1,3}(\.\d{1,3}){3}\b";
let SSHFailures =
    Syslog
    | where Facility == "auth" and SyslogMessage startswith "Failed password for"
    | where TimeGenerated > ago(lookback)
    | extend SrcIP = extract(IpRegex, 0, SyslogMessage)
    | summarize Attempts = count()
        by SrcIP, TimeBucket = bin(TimeGenerated, 1h), HostName
    | where Attempts >= sshThreshold
    ;


union WindowsFailures, SSHFailures,MS365Failures
| extend Geo = geo_info_from_ip_address(SrcIP)
| project
    TimeBucket,
    SrcIP,
    Attempts,
    HostName,
    User365,
    Country   = Geo.country,
    Region    = Geo.state,
    City      = Geo.city,
    Latitude  = Geo.latitude,
    Longitude = Geo.longitude
let IpRegex = @"\b\d{1,3}(\.\d{1,3}){3}\b";

Syslog
| where Facility == "auth" and SyslogMessage startswith "Failed password for"
| extend SrcIP = extract(IpRegex, 0, SyslogMessage)
| summarize Attempts = count() by SrcIP
Syslog
| where Facility == "auth" and SyslogMessage startswith "Failed password for"
| extend AttemptedUser = extract(@"for (invalid user )?(\S+)", 2, SyslogMessage)
| summarize Attempts = count() by AttemptedUser
| top 5 by Attempts desc

SOAR
A SOAR or Security Orchestration Automation and Response is a group of technologies that help manage and automate tasks, it is often used to automatically respond to cyber security incidents.
In this section, I will be connecting EntraID to Sentinel, Creating an analytic rule (to detect anomalous login from outside the US), automaton rule and playbook which will allow me to define the set of tasks that will be executed after our alert is triggered.
Connecting Entra ID
- Create a Microsoft Tenant
- Use the free trial if available
- Provision some accounts
- Go Back to Azure and navigate to Sentinel>Contenthub via the Defender Portal and search for Entra ID
- Install Entra ID, once it finishes installing select it and click Manage.

- This will bring you to this page where you will find the option to connect your EntraID to Sentinel. Make sure you satisfy all the prerequisites and then select the logs that you want to collect. After EntraID is successfully connected you will see the the connector sidebar turn green and log statistics.

Logic App / Playbook
After EntraID is connected, we must create a Playbook. A Playbook is simply a set of guidelines and procedures that should be immediately followed after an incident. However; in this context, it helps to simply think of it as an if statement i.e., if a certain incident, alert or entity is detected do <action>.
For example, I will be using this query to detect successful sign-ins outside the US. The playbook will contain steps to extract the necessary information needed to make an API call to MSGRAPH and subsequently revoke the users active sessions and disable the account upon the detection of a sign-in - in an unauthorized country.
SigninLogs

| where ResultSignature == "SUCCESS" and LocationDetails.countryOrRegion <> "US"
| project TimeGenerated, UserDisplayName, UserPrincipalName, SessionId, DeviceDetail.operatingSystem,UserAgent, LocationDetails.city, LocationDetails.countryOrRegion, IPAddress, RiskLevelDuringSignIn,UserId
- Create a Playbook by navigating to Microsoft Sentinel>Configuration>Automation>Active Playbooks and clicking Create.
- Follow the prompts and create it.
- Edit the playbook or go to Logic Apps and find it there.

- Add the following steps:
- Entities - Get Accounts: This will return an array of accounts associated with the incident.
- Filter Array: As mentioned previously, an array will be returned; I used a conditional to only return valid UserIDs.
- Refresh Token: This will make an API call to MSGRAPH to revoke the current sessions of user.
- Update User: This will make another API call to MSPGRAPH to disable the account.


 3. Save.
Creating Analytic and Automation Rule
The last step is to create an Analytic and Automation Rule. This can be done by navigating to Microsoft Sentinel > Configuration > Automation > Automation Rules> and clicking Create. This will bring you to the Analytic Rule Wizard.
- Fill in the required fields.

 2. At the Automated Response Step, Click add new and fill in the required information. If your Playbook is greyed out , you will need to give it permissions; there should be an option under the drop down box that will take you to the page where you can configure permissions.

- Review and create.
Results
All that’s left is to book a flight to another country and sign in so we can trigger the alert… just kidding. Instead, we can use a VPN to simulate a login from another country.
Once connected to the VPN (make sure you are connected to a node in another country) login into the account.
This should trigger an incident. Navigate to the Defender Portal > Investigation & alerts > Incidents. This is where the Incident will appear, though it may take up to ten minutes.
Once it appears, select the incident > Run Playbook>Runs.
This view shows whether the execution was successful and the time it ran. You can also run the playbook manually from the Playbooks tab.

Additionally, you can view the results of the playbook by clicking on the view run link in the last column.
This opens the playbook flow chart, showing all inputs and outputs.

We can also confirm the Playbook was successful by visiting Microsoft 365 Admin Center and searching for the user. You should see something like this:
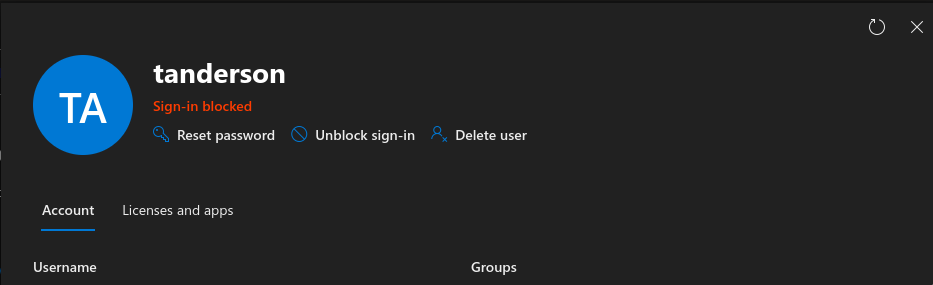
This is just a simple example of what can be done with Sentinel Playbooks. For instance, you might want to send an email and assign the incident to a specific analyst.
Keep in mind that the effectiveness of playbooks and queries depends heavily on the engineer’s understanding of your threat model and environment. Every organization is different, some may be primarily on-prem, others hybrid, US based, international, etc. Your playbooks and queries should reflect those differences.
Conclusion
I really enjoyed setting this up. It was satisfying to apply the knowledge I had gathered through research. Some sections were tedious, but the effort was well worth it.
Through this project, I learned a great deal ranging from basic Terraform to detection engineering methodologies, Tactics and Techniques threat actors use, SIEM configuration, and Azure fundamentals. Overall, it was a valuable experience, and I hope others can use this as a reference.